New Zealand payments stats – 2018 in review
29 Mar 2019
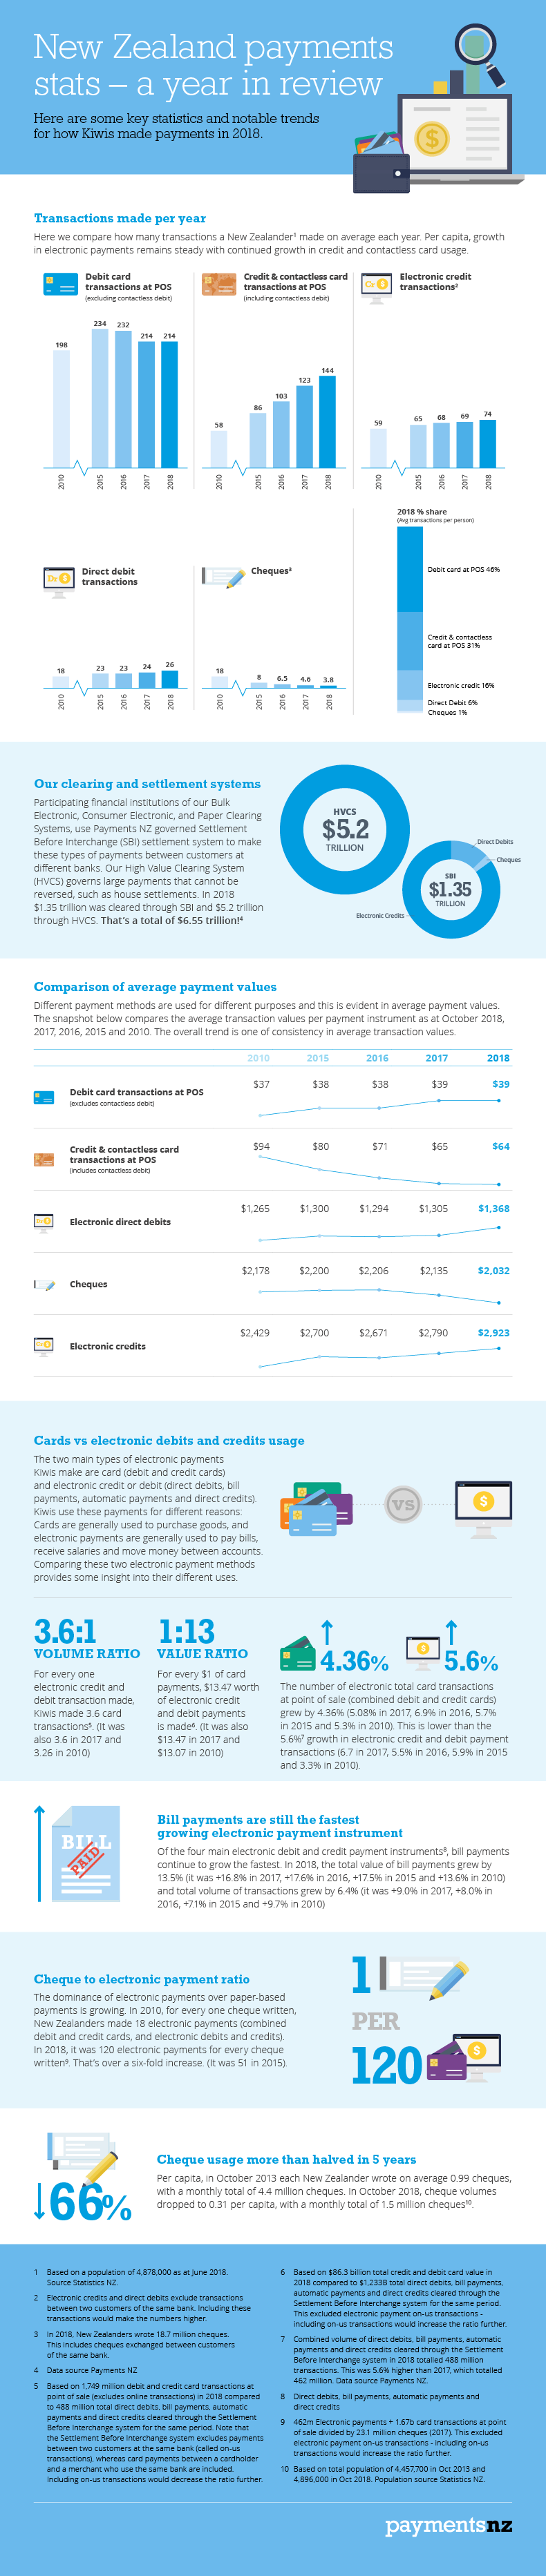
We looked back on how Kiwis made payments in 2018 and put together this handy infographic. Some notable trends include:
- Kiwis made an average of 462 payment transactions each in 2018, excluding online card transactions.
- Cheque payments continue to trend down. In 2018, cheques made up only 4 of the 462 payments made per person (down from 5 in 2017).
- Electronic credit and debit payment volumes grew faster (+5.6%) than total card transaction volumes at point of sale (+4.36%).
- But Kiwis still love paying by card. At point of sale, Kiwis made 358 card transactions per capita (almost 1 a day) in contrast with electronic credit and direct debit payments, which were the next most popular way to pay at 100 transactions per capita.