New Zealand payments stats – 2017 in review
2 Mar 2018
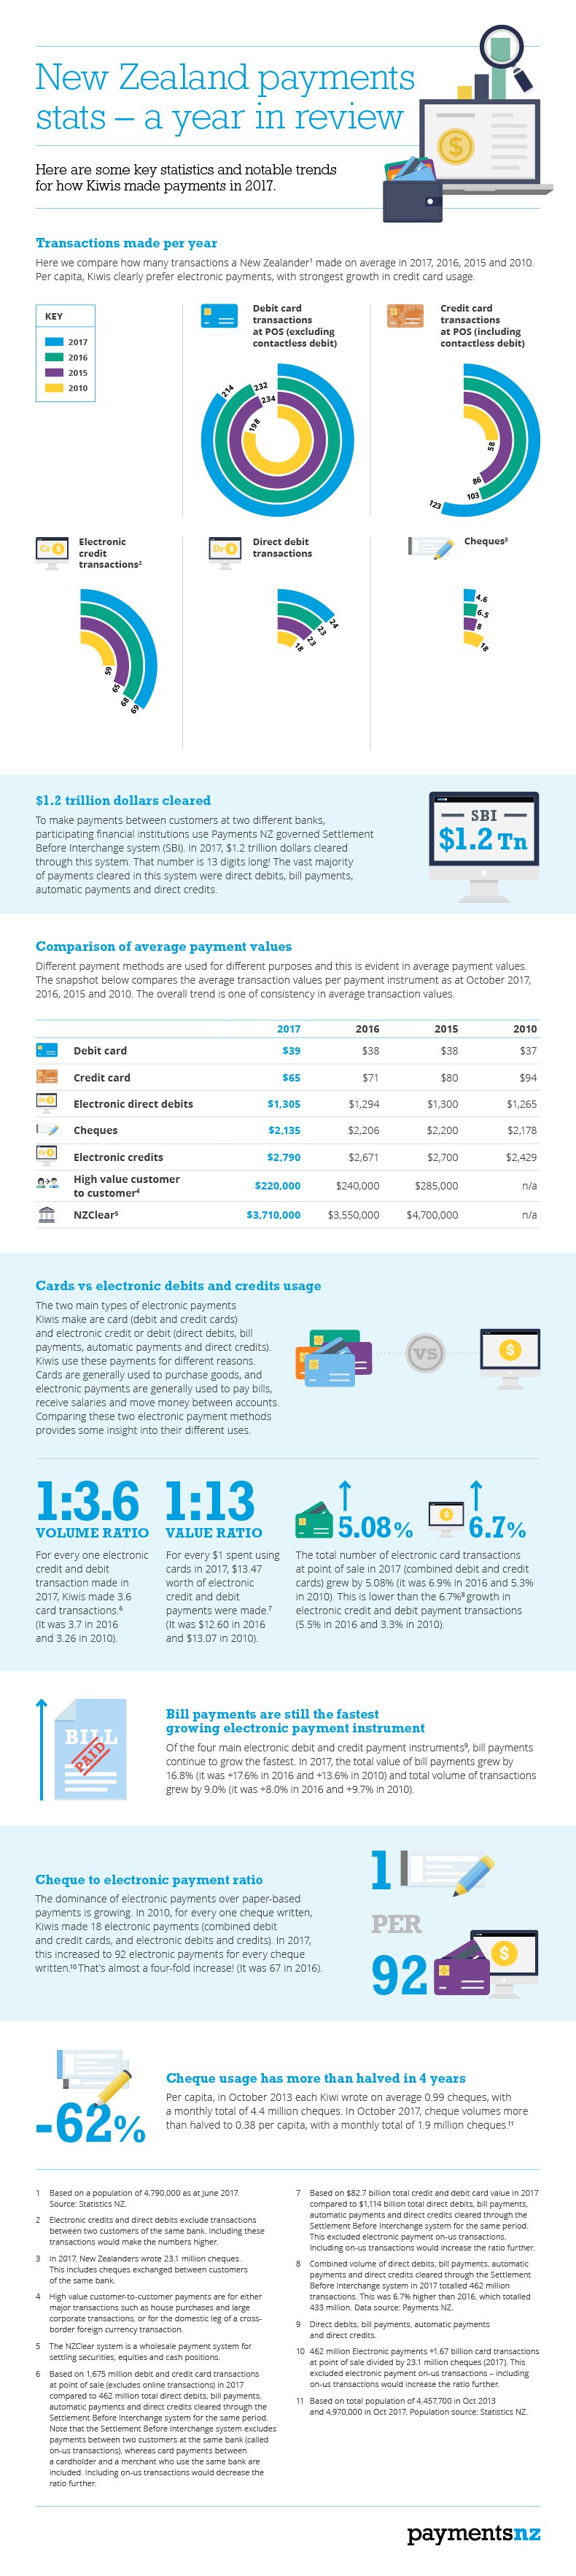
We’ve looked back on 2017 and put together the below infographic of how Kiwis made payments. Some notable trends include:
- Electronic payment volumes grew faster (+6.7%) than total card transaction volumes at point of sale (+5.08%), reversing the trend we saw in 2016.
- Electronic payments are rapidly replacing cheques. For every cheque written there are now 92 electronic payments, whereas in 2010 there were only 18 electronic payments for every cheque.
- Cards are still by far the most frequently used way to pay in New Zealand. At point of sale, Kiwis made 337 card transactions per capita (almost 1 a day) in contrast with electronic payments, which were the next most popular way to pay, at 69 transactions per capita.